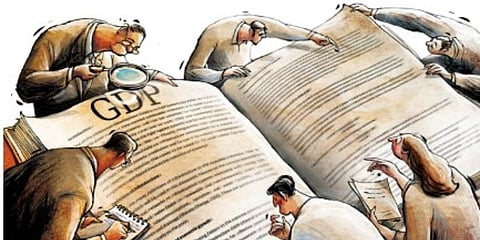

India’s aggregate GDP has become the fifth-largest in the world, overtaking the UK’s. Any country’s GDP is in its own domestic currency. In India’s case, it is in rupees.
To make cross-country comparisons, that has to be converted into a common yardstick or numeraire, typically the US dollar. This can be done using official exchange rates, for instance, roughly 80 rupees to 1 dollar. However, 80 rupees can purchase more in India than 1 dollar can in the USA.
If everything could be freely traded, all prices would equalize across borders. Such free trade doesn’t happen because some items cannot be traded. Economists refer to them as non-tradables. Services are an example. A haircut will be cheaper in India than in the USA. Hence, a notion of purchasing power parity (PPP) has evolved.
The fifth-largest aggregate GDP is based on official exchange rates. If PPP exchange rates are used for conversion, Indian GDP is already the third-largest, right behind China and the USA. A slightly flippant example of PPP is the Big Mac Index, based on how much a Big Mac burger costs in different countries. To compute PPP, we need data on prices in different countries through surveys.
There is an International Comparison Programme (ICP) to gather prices on a common basket of goods and services across countries and it is subject to criticism. There are also time-lags. Present PPP data, collected through Asian Development Bank, are actually from 2017. But to state the obvious, any PPP conversion will relatively increase aggregate GDP, compared to official exchange rates, for a country like India, and relatively decrease it for a country like the USA. There is no inconsistency in this. They measure different things.
Aggregate GDP is one thing, per capita is another (‘capita’ means head—as in decapitate, or capital punishment). Per capita GDP is aggregate GDP divided by population. It is the average income earned by every Indian. One could also say it is the average productivity of every working citizen. Source and year are important when citing any such figure, since they depend on exchange rates, vis-à-vis the US dollar.
Having said that, India’s per capita GDP using official exchange rates (referred to as nominal exchange rates) is just short of $2,500, while the PPP figure will be a bit more than $7,500. As a thumb rule, if one multiplies nominal per capita GDP by three to get India’s PPP per capita GDP, one will not be too far off. Whether official or PPP, this makes India a relatively poor country.
In the World Bank’s present classification of countries, India is a lower-middle income country (the present threshold, using official exchange rates, is $4,255 per capita). A rather pointless debate, especially on social media, has erupted regarding aggregate GDP rank versus per capita rank. They measure different things.
It isn’t quite like ‘the blind men and the elephant’ debate. To stretch the analogy a bit—one measures the elephant’s surface area, while the other measures some other part of the elephant’s anatomy. Both tell us something.
In passing, everyone is aware of the work done by Angus Maddison and those who followed him, stretching back the historical GDP series for various countries. India’s present geographical area isn’t the same as it is in the Maddison-type calculations, for say, 1 CE. More importantly, there too, there is a difference between aggregate GDP and per capita. What is commonly quoted is the aggregate, not the per capita.
Similarly, there has been some unnecessary controversy about UNDP’s recent Human Development Report (HDR) 2022 and India’s HDI (Human Development Index) rank. Before that, there is a notion of a poverty line and poverty ratio (also known as head count ratio). A poverty line is defined as a minimum basket of consumption required to subsist. Using prices, this is converted into a minimum monthly per capita consumption expenditure figure. It is a minimum and nothing more than that.
When originally formulated in the 1950s, it was based on food (calories required), clothing and little else. This was based on private consumption expenditure. Health and education didn’t figure, because it was presumed these would be publicly provided by the State. At that time, in 1951–52, when the first National Sample Survey (NSS) was conducted for consumption expenditure, the poverty ratio was around 45%.
Poverty lines aren’t constant. As economies advance, more and more items are added to what is regarded as “minimum”. For instance, currently, the US poverty line for a single-person household is around $13,600 US dollars, compared to India’s average of $2,500. India’s last official poverty line is one that was devised by the Suresh Tendulkar Committee.
The last such NSS survey, which provided data to compute poverty ratios once a poverty line was fixed, was for 2011–12. At that time, the poverty ratio was 25.7% for rural India, 13.7% for urban India and 21.9% overall (numbers vary from state to state and differ between rural and urban). Since then, we haven’t had a NSS consumption expenditure survey (there is one which has just been started. The one in 2017–18 had methodological problems).
When talking about poverty, one shouldn’t get bogged down by the transient effect of Covid-19. Such an exogenous shock pushes people who are above the poverty line down to below the poverty line. But this reverses itself once growth and employment recover. My guess is—in the absence of data it is no more than that, India’s poverty ratio will be around 20% for rural India, around 13% for urban India, and an overall ratio of around 18%. Poverty has declined, though one can legitimately argue that the decline should have been greater. Over time, declines aren’t linear. But we should aspire for at least a 10% decline in poverty ratios every decade. I shall delve into more on this and HDI in the next column.
The writer is a Chairman of Economic Advisory Council to the Prime Minister